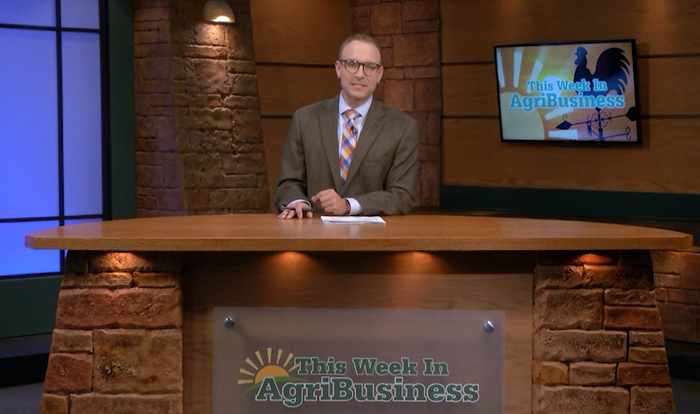
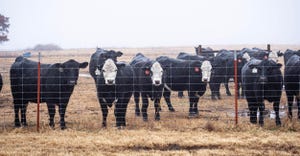
Feedstuffs is part of the Informa Markets Division of Informa PLC

This site is operated by a business or businesses owned by Informa PLC and all copyright resides with them. Informa PLC's registered office is 5 Howick Place, London SW1P 1WG. Registered in England and Wales. Number 8860726.

Delegates act on sow housing

Delegates act on sow housing
- Survey indicates support for group housing. - Producers adopt positions supporting choice in housing systems.

IN a recent survey, 53% of pork producers said they already have housing systems other than gestation stalls or plan to change to more open pens.

Fully 25% said they do not use gestation stalls, 14% said they plan to adopt open pens and another 14% said they plan to convert to stalls with gates that open and permit sows to move around.

Only 10% of producers said they will continue to use gestation stalls.

The survey, commissioned by the National Pork Board and conducted by polling company Moore Information, was reported in an article in the spring issue of the Pork Checkoff Report magazine that was distributed at the National Pork Forum March 7-9.

It should be emphasized that the survey was conducted on a random and small number of producers -- 550 producers -- and that only one-third of them, or approximately 180, said they have sows on their farms, each with fewer than 200 sows, according to  Pork Board senior vice president Mike Wegner, who wrote the article.

The number compares with a universe of 68,300 swine producers in the U.S.

Accordingly, contrary to what activist groups were implying last week, the survey in no way represents the entire U.S. pork industry, Pork Board officials told Feedstuffs.

Indeed, a survey conducted by agricultural economist Ron Plain at the University of Missouri last year determined that 82.7% of all sows in the U.S. are currently housed in gestation stalls (Feedstuffs, June 11, 2012).

Plain said his survey covered producers with 1,000 or more sows and a total of 3.596 million sows, or approximately two-thirds of the total U.S. breeding herd (Table). He said farms housing fewer than 1,000 sows represent a minority of the total sow inventory.


Housing position

Delegates to the board of directors of the National Pork Producers Council (NPPC), following lengthy debate at the delegate session during the Pork Forum, adopted policy saying NPPC "continues to support" producers' choice to use gestation stalls as a housing system that ensures animal care, employee safety and a reliable supply of quality and reasonably priced pork for consumers.

A number of producers said stalls are "essential" for meeting these goals.

Much of the debate centered on NPPC's existing policy in which the council does not support one kind of housing over another, instead allowing producers to choose the housing system that best fits their management and other needs. The existing policy aligns the council with the positions of the American Veterinary Medicine Assn. and the American Association of Swine Veterinarians.

The new policy does not change NPPC's position that producers have a right to choose housing systems, including group pens for pregnant sows. However, delegates opposed to the new policy said it "confuses what (the council) stands for."

Delegates also approved policy urging NPPC to meet with foodservice and retail customers to explain modern production practices and how those practices meet the requirements of animal care and welfare and workplace safety and need to be economical and sustainable.

Delegates to the National Pork Act, which advises the Pork Board on policy, adopted a similar position in their delegate session.

The delegates to NPPC are pork producers sent to the Pork Forum by their respective state associations, and the delegates to the Pork Act are pork producers who are appointed to that body by the secretary of agriculture. The forum houses the delegates' annual business meetings.


Sows in group pens during gestation

Firms responding

Size of firms (sows)

Number of sows at firms (million head)

Current
% of total

% of total in two years

22

1,000-9,999

0.102

20.2

20.7

38

10,000-99,999

1.161

18.9

21.3

10

100,000-plus

2.333

16.4

23.8

Total (70)

-

3.596

17.3

22.9

Source: Ron Plain, University of Missouri.


Volume:85 Issue:11

Hide comments
account-default-image

Comments

  • Allowed HTML tags: <em> <strong> <blockquote> <br> <p>

Plain text

  • No HTML tags allowed.
  • Web page addresses and e-mail addresses turn into links automatically.
  • Lines and paragraphs break automatically.
Publish