What is that sow costing me? (part 3 of 3)
Sows slipping past Day 4 is an expensive lost opportunity. If this can be monitored, it can be improved.
August 1, 2020
Sponsored Content
By Bud Newkirk, Strategic Account Manager at United Animal Health and Joel Spencer, Ph.D., director of Customer Innovation at United Animal Health
With the continued look at Wean to First Service Interval (WTFSI), it is understood that the normal biological response for a properly conditioned wean sow is to be in standing estrus 3-5-days after weaning, ideally on day 4. In general, most production systems utilize performance monitoring systems that report the WTFSI on a 7 day average, which leaves many unknowns as to what is occurring inside this window of time. The average is constantly moving back and forth and when subsequent farrowing occurs, we are left guessing why farrowing rate and total born are going up and down. In two previous articles, we discussed the distribution of which days sows come into heat within this interval (WTFSD), why it’s important, and how to look at which sows are falling out of this target window of 3-5 days. In Fig. 1 below, the significant impact of slipping from day 4 to day 7 for a first breeding is clearly shown. One can easily see how this makes day 4 the most optimal day to have the first service on sows, but only if the sow is in the appropriate body condition and biologically prepared to do so.
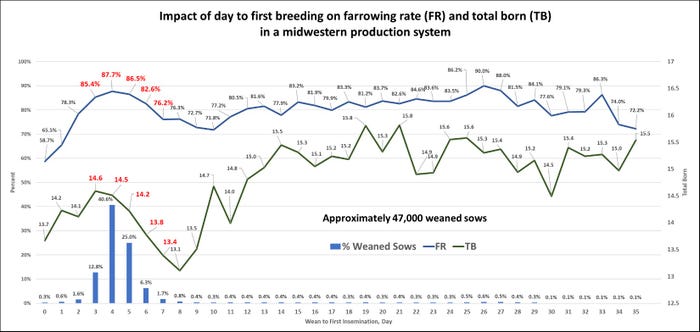
Further interpretation of Fig. 1 indicates if the first heat cycle is missed, good performance can still be obtained when wean sows are bred on days 25-27. These later bred sows were most likely intentionally skipped from the normal breeding schedule and this practice may be unavoidable at times. The higher total born and farrowing rate of sows in these much later breed days does give us a picture of the genetic potential of these skipped sows, but the productive days lost between weaning and breeding has a negative affect toward the lifetime performance of the sow and proves to be very expensive in the long run. There is a cost of lost opportunity for sows not bred on time. Using the WTFSD of the breedings displayed in Fig. 1, we have estimated the economic losses incurred for a sow not bred on day 4 (Fig. 2). One can see the improvements in fertility by skipping sows and breeding them out on day 25-27 (green line), but this improvement cannot overcome the costs incurred with the nonproductive days (NPD) and feed costs (red line). The overall lost potential for a sow not being bred on day 4 is significant (purple line).
Even a slight improvement of 4% of sows bred on day 4 will generate approximately 40 more weaned pigs per 100 breeding eligible weaned sows. Systems won’t eliminate sows slipping past day 4, nor will they eliminate sows slipping past day 7. However, if this can be monitored, it can be improved, resulting in efficiency gains through more pigs and reduced costs.
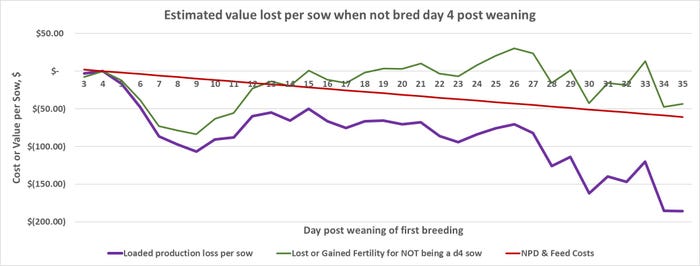
Figure 2. Estimated opportunity loss per sow ($/sow) when she is not bred on day 4 post weaning (purple line).
There are numerous factors that can impact total born, farrowing rate, or cause a sow to slip past the target 3-5-day window. Everyone at the sow unit contributes to these outcomes, not just the individuals working in the breeding row. The key is to not only monitor the WTFSI, but to also understand the distribution of sows showing signs of first estrus on each day within that interval. Measuring the WTFSD and determining which sows are slipping past the optimal target of day 4 (either into day 6 and 7, or even further out to day 20+) allows a system to make decisions that can significantly reduce economic losses. If producers are looking to reduce sow inventory and improve production efficiency, looking at this WTFSD can help determine which sows should be considered for culling. Understanding this distribution helps identify individual sows and specific sub populations, such as those that slip in to day 6 and 7, or those that move out to day 20+; but in addition to this, many systems are now consistently measuring, interpreting, and acting upon a weekly measurement of the percent of sows bred within the 3-5 day window as it gives a more sensitive measurement of the overall health and reproductive state of the entire sow unit. When that number moves up or down, finding the why will likely yield the greatest economic return in the short and long run. Remember, it isn’t always about finding something wrong. Identifying what is going well and giving someone credit for influencing this number in a positive way may be the most beneficial finding of all.
About the Author(s)
You May Also Like

.png?width=300&auto=webp&quality=80&disable=upscale)
