The need to double click on reproductive fitness to make more informed decisions.
June 1, 2020

Sponsored Content
By Joel Spencer, director of Customer Innovation at United Animal Health
With the swine industry backed up with market-ready pigs due to reduced processing throughput, it's hard to think ahead to 2021 when the challenges of today are so very real. However, there will be future opportunities when we return to a new normal and the world demands its favorite protein. As we think forward, it's important to plan for, measure and manage the details that will impact how much opportunity we can capture in the future. Should I cull sows, and if so, which ones? How can I have more pigs to sell in 2021 with fewer sows? In a series of discussions over the next few months, we will double click on sow reproductive fitness and critically evaluate what good looks like.
Measuring the average wean-to-first service interval or looking at the percentage of sows bred by Day 7 post weaning is a common metric that the industry uses to evaluate sow reproductive efficiency. While these metrics can provide a high-level overview, do they give producers the ability to drive real improvement and make impactful decisions? Have we become comfortable with these general values that are diluted with below-average sow performance? Understanding the wean-to-first service distribution in a herd is important if we are to identify which sows are limiting herd performance.
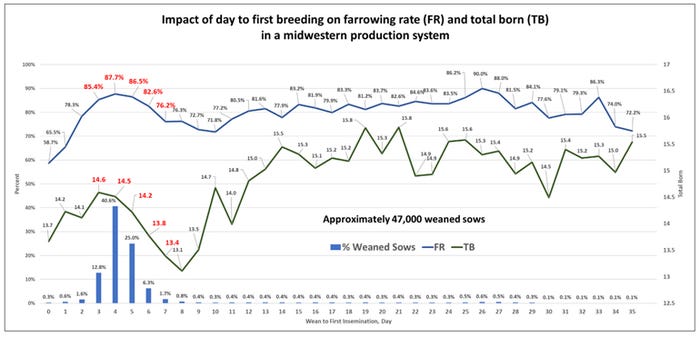
We evaluated sow records within a large production system in the Midwest over 2018 and 2019. General reports were pulled from a record-keeping system so the WTFSD could be charted and evaluated. Sows included in this evaluation must have had a weaning event and subsequent breeding event. Results of approximately 47,000 wean events were collected and are shown in Chart 1. Subsequent farrowing rate and total born are shown by day of first insemination post weaning, along with the percentage of sows in the data set that fell on the specific day.
Chart 1.

When looking at how weaned sows are distributed across days of first insemination, we can identify which sows are contributing the most to profitability. Sows that had their first breeding four days post weaning had over an 11-point improvement in farrowing rate, and over a pig more total born in their subsequent farrowing when compared to sows bred seven days post weaning. "Sows bred on day 6 and 7 for the first time postweaning really aren't normal for some reason, so let's dig into why that is." This is a common message from industry reproductive physiologist Steve Terlouw, and it is easy to understand his comments when you look at the distribution of sows in this manner. So why do we continue to use averages, and why don't we narrow our target window to not go past Day 5? Bottom line is we dilute our WTFSI metrics with sows that are bred after Day 5, and this significantly reduces our ability to make informed decisions that can improve production efficiency. Although current record keeping systems don't provide the necessary detail in a manner that is consistent, sustainable and part of a daily practice, we can chart the distribution weekly on our own to identify sows that have moved out of our target five-day window. Record programs will soon catch up and make this even more efficient.
Regarding reproductive fitness, we have general metrics of average days to breeding and percent of sows bred by Day 7 to know what good looks like. But to move from good to great, and great to excellent, we need to identify sows that have moved past Day 5 so we can dig deeper to understand why: what has changed, what went wrong, or what has worked? This type of resolution will allow us to make better decisions and capture a higher percentage of our opportunities in the future.
About the Author(s)
You May Also Like

.png?width=300&auto=webp&quality=80&disable=upscale)

