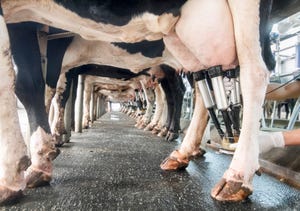
Livestock & Poultry Market news
thumbnail
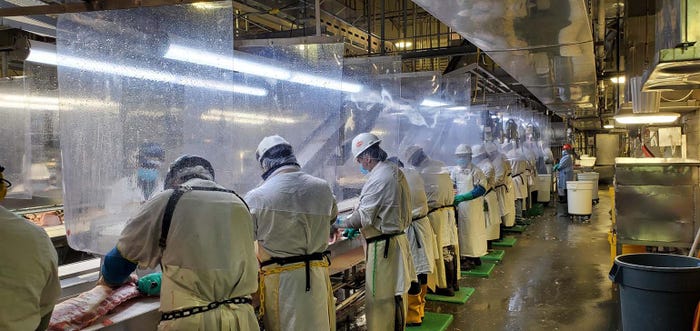
Agribusiness NewsOlymel to close poultry, pork plant in QuebecOlymel to close poultry, pork plant in Quebec
Falling production volumes led plant to operate at only 40% of its operational capacity.


Recent Headlines


.png?width=300&auto=webp&quality=80&disable=upscale)

Enter a zip code to see the weather conditions for a different location.

Subscribe to Our Newsletters
Feedstuffs is the news source for animal agriculture