thumbnail
Agribusiness NewsConnect to build trust around the tough issuesConnect to build trust around the tough issues
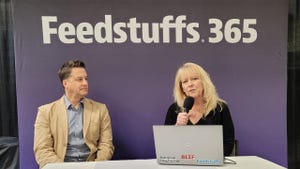
Brian Fretwell, founder of Finding Good, shares a science-based approach of leading and connecting through smarter questions.


.png?width=300&auto=webp&quality=80&disable=upscale)

.png?width=300&auto=webp&quality=80&disable=upscale)
.png?width=300&auto=webp&quality=80&disable=upscale)
.png?width=300&auto=webp&quality=80&disable=upscale)
.png?width=300&auto=webp&quality=80&disable=upscale)

.png?width=300&auto=webp&quality=80&disable=upscale)


.png?width=300&auto=webp&quality=80&disable=upscale)

.png?width=300&auto=webp&quality=80&disable=upscale)


.png?width=300&auto=webp&quality=80&disable=upscale)

Recent Headlines


.png?width=300&auto=webp&quality=80&disable=upscale)
Current Conditions for
New York, NY
47°F
Partly Sunny
Day 60º
Night 43º
6.97 mph
Enter a zip code to see the weather conditions for a different location.

Subscribe to Our Newsletters
Feedstuffs is the news source for animal agriculture