Updated: U.S. corn, soybean acreage down 1%.
June 29, 2018

Corn and soybean acres are estimated to be 1% lower compared to a year ago, according to USDA’s hotly anticipated acreage report, out Friday morning. In contrast, all wheat acres are up 4%, with cotton acres up 7% over last year, the agency reports. Grain prices saw a moderate boost immediately following the report.
“Sometimes, grain markets make highs at the end of June,” says Farm Futures senior grain market analyst Bryce Knorr. “But occasionally, they confirm lows. Trading over the next week or so will determine which type of pattern prices are following in 2018. So far, markets appear to be mostly moving past today’s reports, which is a good thing, especially for corn.”
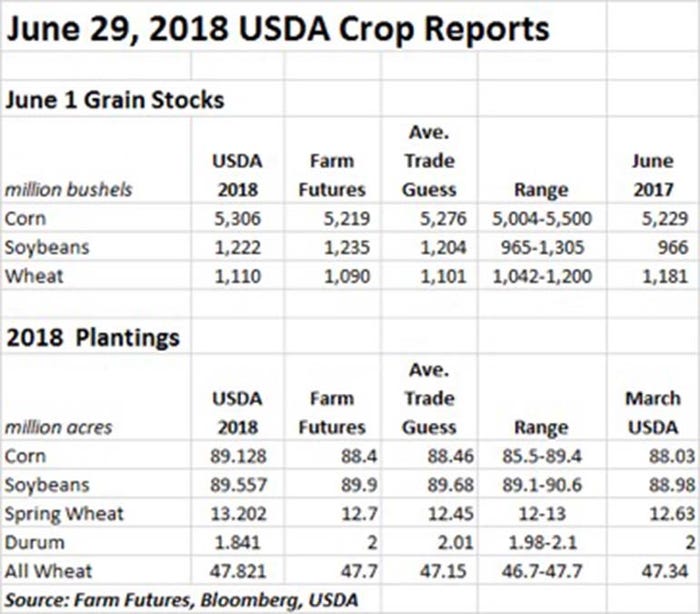
USDA estimates that corn acres reached 89.128 million acres in 2018. In 31 out of 48 states, the agency estimates flat or slightly lower acreage compared to 2017. That number is still higher than USDA’s March estimates of 88.03 million acres, however, with the average trade guess also lower, at 88.46 million acres – including a Farm Futures estimate of 88.4 million acres.
“The acreage number isn’t a complete surprise, because our March survey was even higher,” Knorr says. “But again, it’s more bushels that will add to carryout in the coming year, putting even more emphasis on yields and growing season weather for the rest of the summer.”
The agency’s estimate for soybean acres also trended 1% lower from a year ago, with 89.557 million acres. That’s moderately higher than USDA’s March estimates of 88.98 million acres but slightly lower than the average trade guess of 89.68 million acres, including a Farm Futures projection of 89.9 million acres.
Double-cropped acreage doesn’t make USDA’s latest soybean estimates the final word, Knorr says. The market’s dynamics aren’t really altered for now, he says, but the next challenge arrives soon enough.
“Soybeans’ real test comes July 6, when we learn whether China will slap 25% tariffs on imports from the U.S.,” he says. “Until the trade situation clears up, it’s going to take some real weather to move the market higher.”
All wheat acres, in contrast, are up 4% from a year ago, according to USDA, with 47.821 million acres. That also landed higher than the average trade guess of 47.15 million acres, including a Farm Futures estimate of 47.7 million acres. Spring wheat acres accounted for much of this boost, coming in at 13.202 million acres – significantly higher than USDA’s March estimates of 12.63 million acres, as well as the average trade guess of 12.45 million acres.
USDA’s grain stocks report, also out Friday morning, offered more bearish data for today’s grain markets, starting with corn stocks, which rose from 5.229 billion bushels last June to 5.306 billion bushels. The trade was anticipating a more modest boost, to around 5.276 billion bushels.
USDA noted a divergent trend regarding on- and off-farm storage for corn stocks. On-farm corn stocks are at an estimated 2.75 billion bushels, down 3% from a year ago, while off-farm stocks of 2.56 billion bushels moved 7% higher this year. Disappearance of 3.59 billion bushels between March and May grew 5.9% year-over-year, according to USDA.
Knorr notes that it can be easy to read too much into grain stocks data because so much can change from one quarter to the next, and some expectations can be simply due to statistical error and the difficulty of measuring so much grain.
“But taken at face value, the June 1 total suggests USDA is too high with its forecast for feed usage by around 100 million bushels,” he says. “That’s not a game-changer, but it does offset some of the good demand seen in usage by ethanol plants and exports.”
Domestic soybean grain stocks grew even more significantly from a year ago, moving from 966 million bushels last June to 1.222 million bushels. Trade analysts were expecting a more modest increase of 1.204 billion bushels.
USDA reports that soybean on-farm stocks of 377 million bushels and off-farm stocks of 845 million bushels are both significantly up from a year ago, moving 13% and 33% higher, respectively. Disappearance from March to May, at 888 million bushels, is up 15% from last year.
Domestic wheat stocks fell slightly, from 1.181 billion bushels to 1.110 billion bushels, slipping 7% from last June. The average trade guess was 1.101 billion bushels, which included a nearly on-the-nose estimate of 1.090 billion bushels from Farm Futures.
On-farm wheat stocks tumbled 32% from a year ago, reaching 130 million bushels. Off-farm stocks of 970 million bushels are just 2% lower than they were last June. Disappearance between March and May totaled 395 million bushels, down 17% year-over-year.
“Both of USDA’s reports were a little bearish for wheat,” Knorr says. “But wheat’s hopes depend on demand, which in turn is a factor of global production. With smaller crops expected in key growing regions, wheat may be finally ready to confirm lows if it can avoid fallout from the trade dispute news cycle.”

You May Also Like


