Subscribe to Our Newsletters
Feedstuffs is the news source for animal agriculture
First-of-its-kind interactive map brings together 40 years of water quality data.
April 5, 2017

You May Also Like
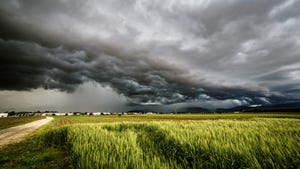
Enter a zip code to see the weather conditions for a different location.